Note
NDVI vs true colour imagery for archaeological prospection
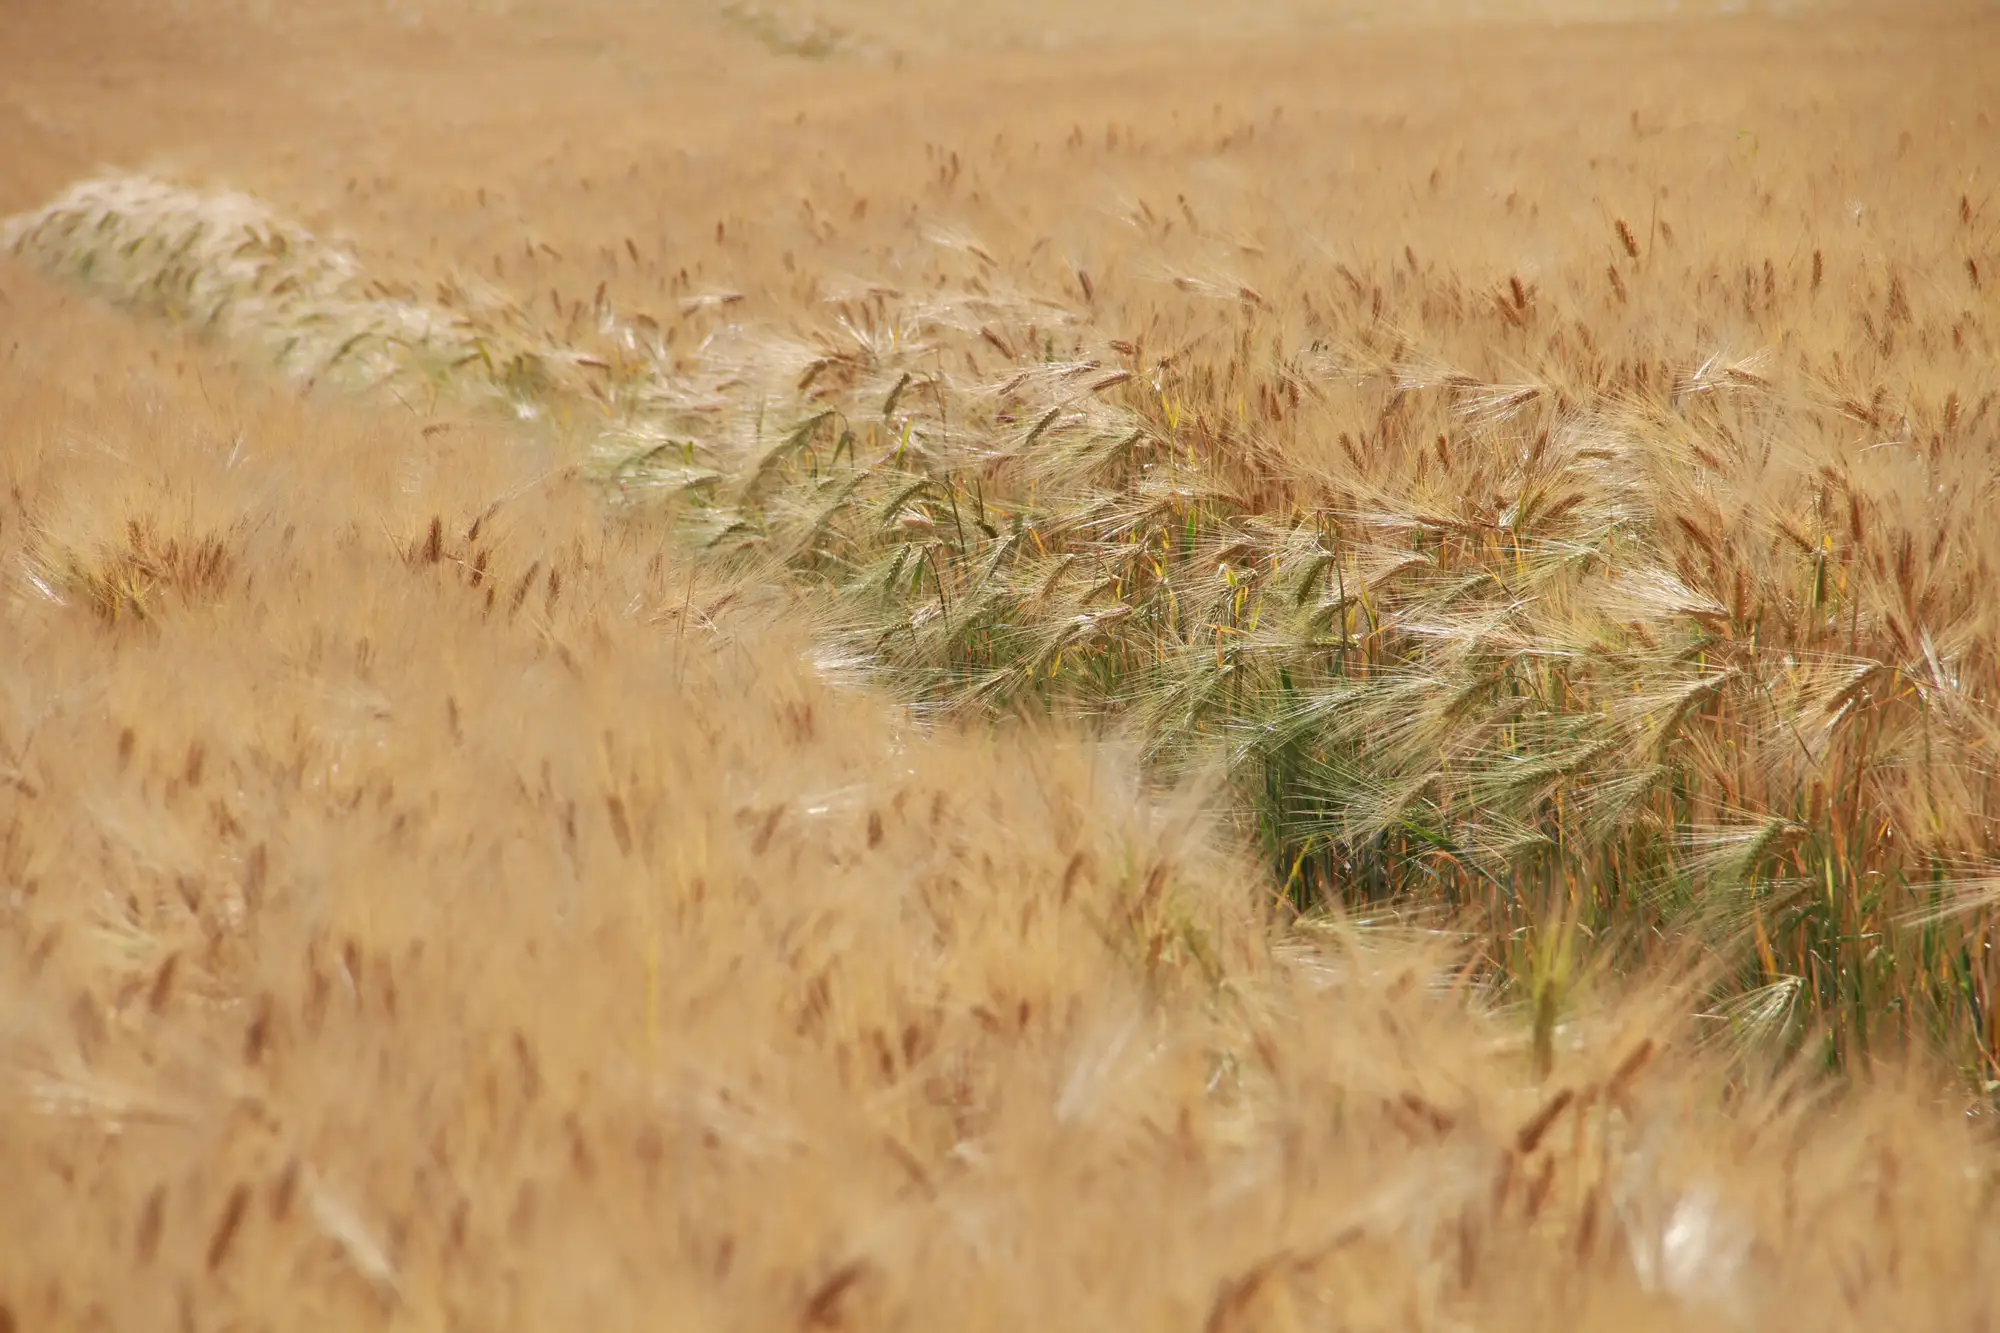
Every desk-based assessment hits the same fork: you've got an area of interest, a growing season ahead of you, and a decision to make about what kind of imagery is going to earn its keep in the report. True colour aerial photos are the default because they're cheap, familiar, and every archive holds decades of them. NDVI, and near-infrared composites generally, cost more to source and read differently. The question worth answering before you commission anything is what each one actually measures, because they're not interchangeable.
What NDVI is actually measuring
NDVI stands for Normalised Difference Vegetation Index. It's a ratio between the red band and the near-infrared band, and it tracks chlorophyll activity and canopy structure rather than colour as the eye sees it. Healthy, well-rooted crop reflects strongly in the near-infrared and absorbs red light for photosynthesis. Crop sitting over a buried ditch, where the soil holds moisture longer and roots run deeper, tends to stay greener and grow taller for longer into the season. Crop over a buried wall or a compacted surface dries out faster and stresses earlier. NDVI picks up that difference in plant vigour before it's obvious to someone walking the field, often well before it shows as a visible colour change at all.
True colour imagery only has the red, green and blue bands to work with, so it shows you the cropmark once the stress has gone far enough to change the plant's actual colour: the yellowing or lodging you'd catch from a hilltop or a drone in good light. That's a narrower window. By the time a parchmark is visible in true colour, the crop may already be past the point where the contrast is sharpest.
Where true colour still earns its place
None of this makes true colour obsolete for a DBA. Historic aerial photograph archives are true colour or panchromatic, and they're still the backbone of any cropmark search going back decades, because NIR imagery of most of the country simply doesn't exist for 1976, or 1990, or 2006. True colour is also what you'll cite when you need a record an external reviewer can interpret without an explanation of spectral bands first. And for some features, parchmarks on grassland, soilmarks on bare ploughed ground, the visible-light signal is the whole story. There's no vegetation canopy for NIR to read.
The practical answer most units land on is to run both. True colour covers the historic record and the features that show up in visible light. NIR or NDVI covers the current growing season, catching the differential growth before anyone's had a chance to walk the field, let alone fly a drone over it in the one dry, cloudless week when the light's right.
Multispectral cropmark survey: what it adds beyond a single band
A multispectral pass doesn't just add infrared. It gives you red, green, blue and NIR together, so you can derive NDVI, run a false-colour composite, or go back to a straight true-colour view from the same capture, without a second flight or a second satellite tasking order. For a DBA, that's the difference between hoping the one site visit lands in the right weather window and having a record of the whole growth cycle to work through afterward.
The catch with doing this by hand is that NDVI rasters and false-colour composites still need someone to go through them field by field, checking them against plot boundaries and the known monument record. That's exactly the kind of manual interpretation that eats the week before a report is due.
That's the gap Buried Feature Detection is built to close: it reads NIR imagery over your survey area through the growing season and returns a georeferenced cropmark layer you can drop into your desk-based assessment or drag straight into QGIS, instead of a stack of band composites waiting for someone to squint at them. If you've got a growing season and a DBA deadline lined up, it's worth seeing what the layer looks like over your own survey area.