Cropmark layer
GeoJSON
A georeferenced layer of flagged anomalies over your survey area. It opens in QGIS and ArcGIS. Serves the "finding the marks" row.
Buried Feature Detection reads near-infrared imagery over your survey area in the growing season and flags the crop patterns that can mark buried walls, ditches and palaeochannels. You get a map layer for the desk-based assessment instead of a folder of aerial photographs to squint at.
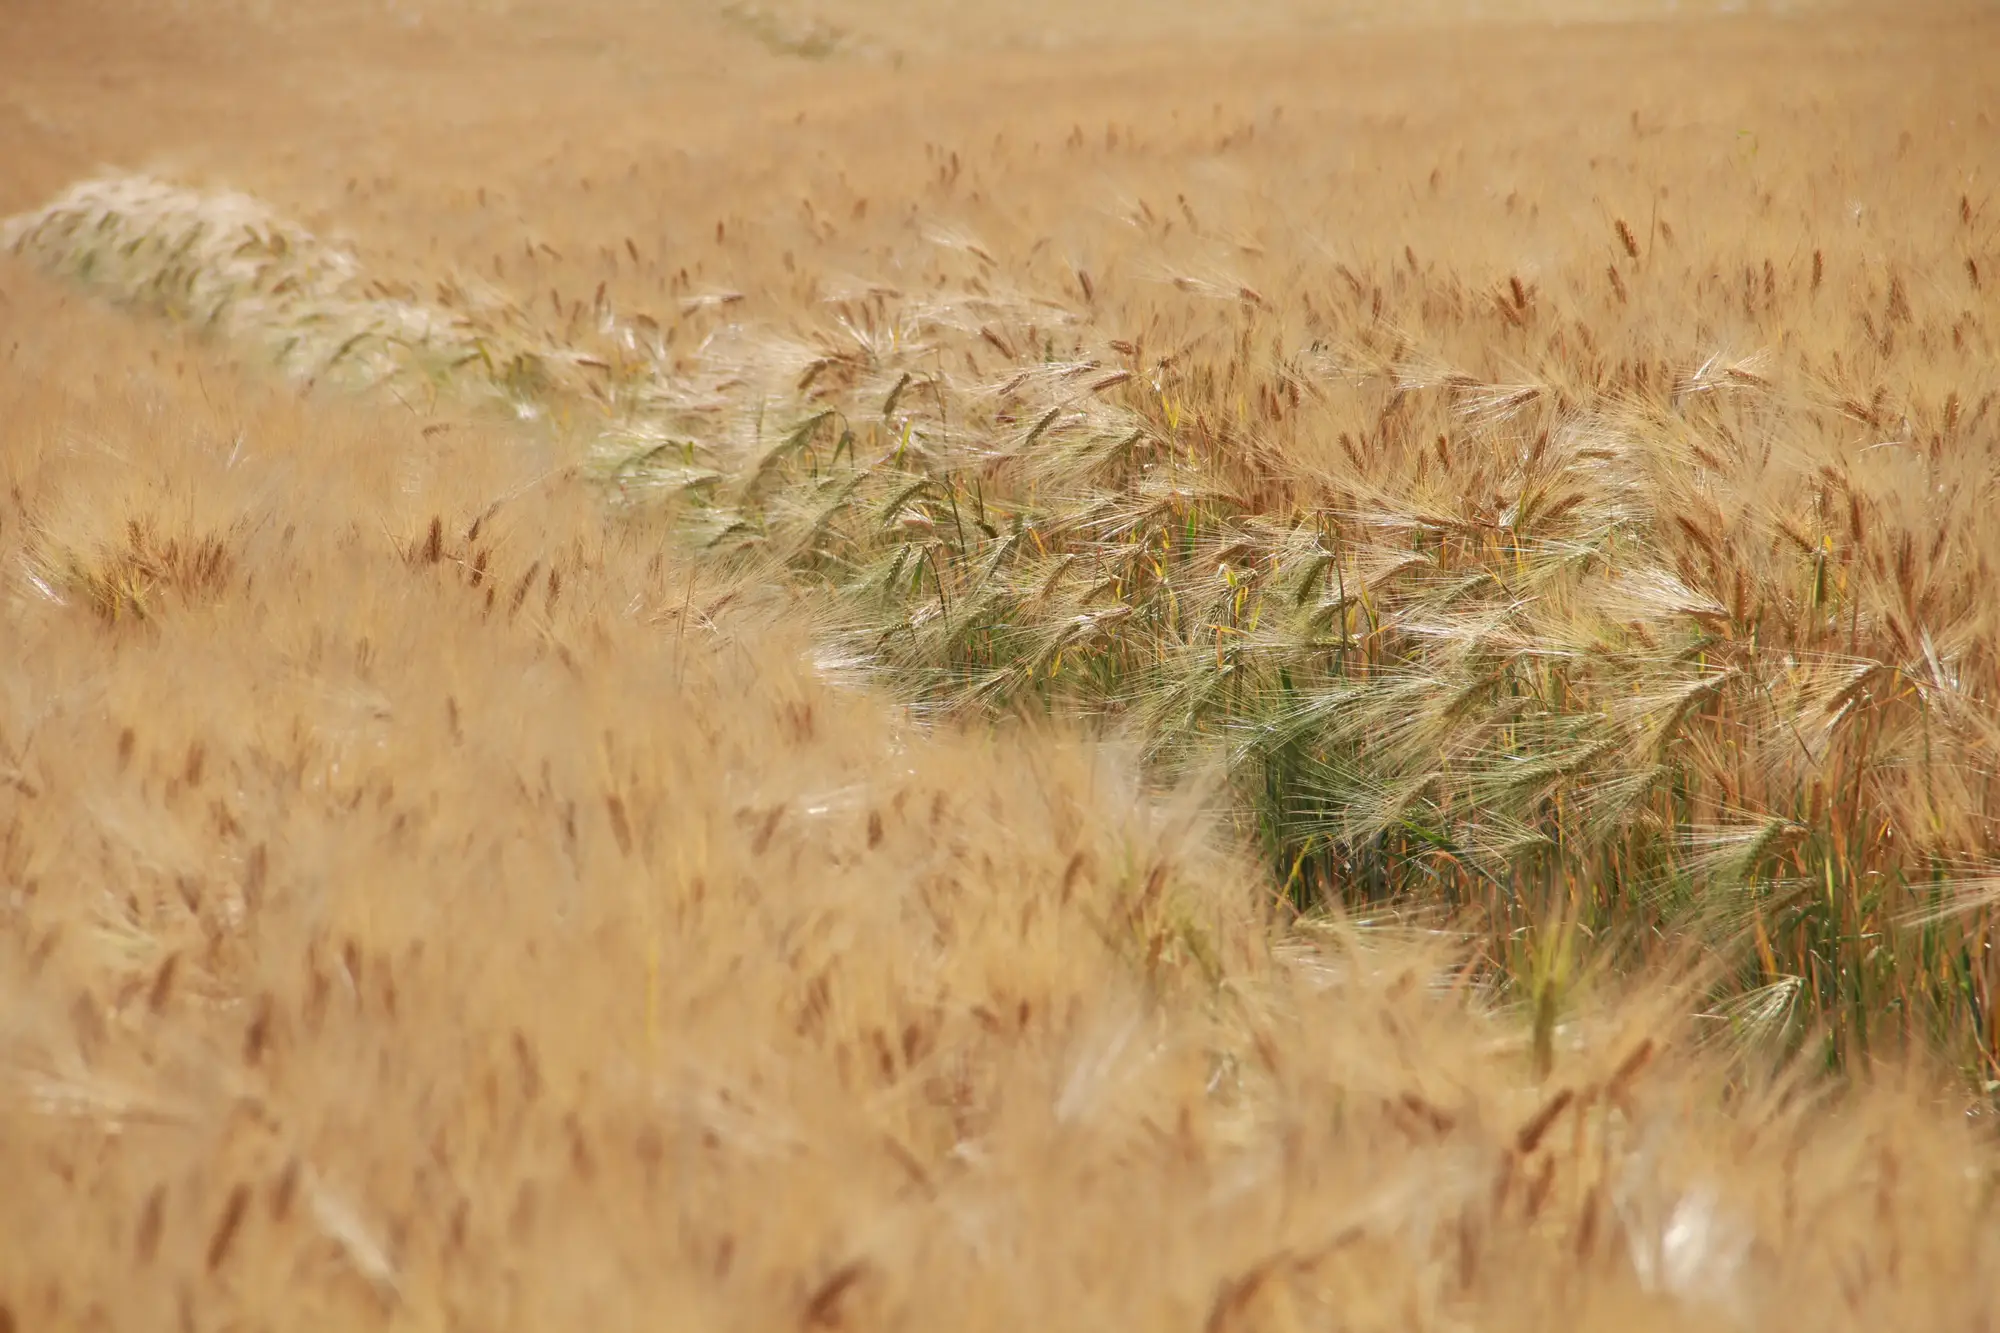
You open the HER and the old photographs for the site. Some fields have good cropmark coverage and some have none, because a flight only caught a dry spell over the ones somebody happened to fly. So you watch the forecast, wait for the crops to show stress, and send someone out before the marks fade. Miss the window and the site waits a year.
Then the anomalies you do find get redrawn by hand into the GIS, and the DBA goes out with a geophysics plan built partly on a hunch.
| No. | Step | Today | With Buried Feature Detection≤0.5 m (VHR) · RGB + NIR · VHR satellite / aerial · Seasonal window |
|---|---|---|---|
| 01 | Timing the look | You watch the weather and the crops, then book a flight or send someone to walk the field when the stress looks right. If the window is missed, the site waits a year. | We read NIR imagery over your survey area across the growth window and tell you which passes were usable. |
| Still yoursDeciding when the project needs its answer. | |||
| 02 | Coverage of the survey area | You rely on whatever aerial photographs the archive holds, taken on other people's flights in other years, so coverage of your fields is uneven. | One consistent read over the whole boundary, every pass dated. |
| 03 | Finding the marks | Someone looks at the photographs by eye and transcribes what they think they see. | The imagery is read for differential growth against the surrounding field, and candidate anomalies are flagged on a layer with a confidence note each. |
| Still yoursJudging which flags are worth following up. | |||
| 04 | Clean pass or inconclusive | A set of photographs with nothing obvious on them is ambiguous. No marks could mean no features or the wrong weather. | Each pass is reported as usable or inconclusive, so a clear sky and the wrong crop stage is not read as an empty field. |
| 05 | Getting it into the DBA | Marks are redrawn by hand into the GIS and the figures. | A georeferenced layer and a rendered overlay, with source imagery dates attached. Drag the layer into QGIS or put the overlay in the appendix. |
| 06 | Where the magnetometer walks | Geophysical survey is planned across the whole area or by hunch. | The layer shows where the crop is already pointing, so you can walk those places first. |
| Still yoursThe geophysical survey, the trial trenching, and every interpretation of what a feature is. | |||
GeoJSON
A georeferenced layer of flagged anomalies over your survey area. It opens in QGIS and ArcGIS. Serves the "finding the marks" row.
List with confidence notes
Each flagged anomaly with a note on how confident the read is, for checking against your HER and geophysics. Serves the same row.
Image for the report
The layer drawn over the source imagery, ready to place in your DBA appendix. Serves "getting it into the DBA".
Attached to every pass
The dates of the imagery behind each result, and whether the pass was usable or inconclusive.
Each growing season
A new layer each growing season while conditions hold. On a site you revisit, compare one season to the next.
Before the season
You send the boundary of the survey area, with the season you are scoping for. Do it early in the year, well ahead of the growth window.
During the growth window
We collect NIR imagery over the boundary while the crop is growing. Optical imagery needs clear sky, so some passes won't be usable, and we say which.
After the pass
The imagery is read for differential growth against the surrounding field. Anomalies go on the layer with a confidence note, and the source imagery dates go with them.
Before the DBA is signed off
The layer, the list and the overlay come back for the assessment and to shape the geophysics plan. On a later visit we refresh it.
This reads vegetation, not soil. Nothing shows unless the crop is stressed, and that depends on the crop, the soil and the weather. We never guarantee a mark will appear in a given season.
Optical passes need clear sky and the right crop stage. A cloudy or off-season pass returns nothing usable, and we report it as inconclusive. It never means there is no feature.
At 0.5 m a pixel is wider than a hairline crack or a post-hole. A linear pattern across the field is what the layer can pick up. Small single features won't be traced.
A flag says something odd is going on in the crop. Whether it is a wall or a ditch is a hypothesis, and how old it is cannot be told from imagery.
This sits ahead of geophysical survey and trial trenching. It narrows where they go. It does not replace either.
No. It is a first-pass screen, and geophysics and trenching still do the checking. Use it to decide where they go.
Then little shows, because crop stress needs the right soil and weather. We flag each pass as usable or inconclusive, so a quiet season isn't read as an empty site.
Lay the layer over your HER records and any earlier geophysics for a site you know well, and see whether it finds what your own people found. Do it before you rely on it for a new one.
No. The layer locates candidate anomalies. Interpreting them is the field director's job, and dating needs the ground.
VHR at 0.5 m or finer, with RGB and NIR bands. That suits linear patterns such as ditches and wall lines, not single small features.
Yes. Optical imagery needs clear sky, and we report which passes were usable.
A GeoJSON layer that opens in QGIS and ArcGIS, a list of flagged features, and a rendered overlay for the report.
Ownership and licence terms are agreed before the work starts, including what may be published in a DBA or a report. If your legal team wants to read them first, ask early.
We price it for your boundary and do not quote a price on this page. Send the survey area and we will come back to you.
Send us the survey area and the season you are planning for. We will tell you whether the imagery window can serve your DBA.
Get started